
By Henry Bushell
Illustration by Keo Morakod Ung
In mainstream economic discourse, when inequality is discussed, it is usually discussed in the context of income inequality. In general, income inequality in the UK increased in the years between the start of Thatcher’s government and the beginning of the Great Financial Crisis. This focus on income inequality does make sense: the level of an economic actor’s income, especially when compared with the income of the people around them, is a large determinant of behaviour. Orthodox economics’ focus on incentives as determinants of actions, alongside the fact that the determinants of income inequality are easier to parse out than those of wealth inequality, means income inequality is far more interesting and easier to handle than wealth inequality in the mainstream framework.
The determinants of the distribution of wealth are complex, layered and disputed. Unlike income inequality, which can be analysed through the lens of the current tax regime, relative rights and bargaining power of workers and capitalists, the level of education of the workforce, the level of technological sophistication of an economy among many other things, deriving the determinants of wealth inequality requires looking not just at current policies and economic factors, but factors stretching back potentially since the dawn of considerable wealth creation in the 18th and 19th centuries. Determinants include the level of taxation on wealth, historic income levels of different economic classes, the ratio of asset prices (notably house prices) compared to median incomes and the level of government policy which aims to curb excessive wealth accumulation. Discussing and critically analysing the determinants of wealth and income inequality is out of the scope of this piece and is more in the remit of rigorous research in academic papers. Instead, this piece aims simply to investigate and describe the pattern of wealth distribution in the UK over recent years.
Firstly, let’s look at the current distribution of wealth in the UK. A recently released House of Commons Library Research Briefing claims that the Gini coefficient, which gives a measure of wealth inequality across the whole population of a country, was 0.59 for the UK in April 2020 to March 2022. This means that if you pick two random British people, on average one will be about 4 times wealthier than the other. This is much more unequal than the distribution of income. Different types of wealth have different distributions with net financial wealth, net value of savings and investments, being the most unequal with a Gini of 0.87 in March 2020-April 2022 (meaning that for two random British people, one will have 14.4 times more financial wealth than the other!) and physical wealth, net value of vehicles, collectables and household possessions, being the least unequal with a Gini of 0.47 in the same time period. Based on ONS figures referenced in Briefing, in April 2020 to march 2022 the richest 10% of the UK’s population owned almost 400 times as much wealth as the least wealthy 10%, with the same top decile owning over 4 times as much wealth as the poorer half of the country.
Now, let’s look at how wealth inequality has changed over time in the UK. Since 2010, Credit Suisse has periodically released Global Wealth Databooks and Global Wealth Reports which often publish figures for the wealth Gini coefficient for various countries, including the UK. These data likely aren’t perfect (and don’t always line up perfectly with other data sources such as the above House of Commons Research Briefing), but it gives a perspective of patterns of wealth inequality in the UK in recent history.
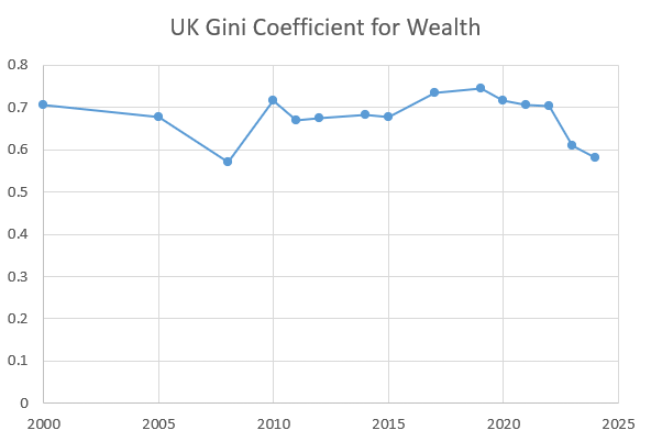
Source: Credit Suisse and UBS Global Wealth Databook/Report, from versions 2010 to 2025
What we see is interesting. The coefficient hovers around 0.7 (for two random British people, one is 5.7 times wealthier than the other on average), with two notable exceptions, these being large decreases in wealth inequality during the 2008 financial crisis and in the post-Covid period. The reasons for these crisis-time slight equalisations in wealth are many. Just one example is that in times of crisis the value of shares usually falls sharply; shares are disproportionately held by the wealthiest in society, as explained earlier.
Based on this one metric, examining changes in wealth inequality is uninteresting. It would appear that wealth inequality has been fairly stable in recent history, with the previously referenced House of Commons Library Research Briefing claiming that the Gini coefficient for wealth has been stable since 1980. Does this tell the whole story?
Another way to examine wealth inequality is by looking at the very rich in our society. According to Credit Suisse/UBS’s Global Wealth Databook 2023, the share of the wealth held by the top 1% of households increased from 12.5% to 22.6% between 2008 and 2017, a staggering increase of wealth held by UK’s society’s richest. In the same report, they even note that these numbers are likely an underestimate, as rich households less likely to take part in surveys. This rise in concentration of wealth shows the wealth of the rich recovering sharply after Great Financial Crisis. Whilst other data in the same report shows that this wealth share may have fallen again during the pandemic period, it may take some years of data collection before a clearer picture emerges.
Based on data in the same Databook, the share of wealth of the bottom 60% of households fell from 15.7% to 11.1% between 2008 and 2019, and for the bottom 40% of households it fell from 4.6% to 2.8% in the same time period. Between 2008 and 2019, the UK’s Real GDP increased by a total of 16.2%. The combination of slow GDP growth averaging 1.37% per annum, a decrease in the share of wealth held by working and middle-class households and an increase of the share of wealth held by the top 1% of households points to a general relative upwards redistribution of wealth over this time period. This conclusion should be taken with a large pinch of salt, and greater research into this area should be done before conclusions are made.
Reliable data on levels of wealth are difficult to come by and I would urge the reader to look further into primary sources and come to their own conclusions. Based on this surface-level research, I could conclude that wealth inequality is worsening, or that it is staying roughly the same. Progressive voices may point out that this is missing the point: it can convincingly be argued that the level of wealth inequality in 2025, like it was in 2008, is unacceptable in the current era where the government lacks funding to tackle pressing issues relating to healthcare, climate, education and social care in the UK. The New Economics Foundation points out that the costs of remedying these problems are often small in comparison to the wealth held by just the billionaire class in the UK, meaning that as a country we can afford to tackle these problems, and they also note that wealth, and income derived from wealth, is usually taxed at a lower rate than income derived from working.
The wealth tax is a popular policy with the progressive left currently, with progressive economic thinktanks and politicians alike calling for the policy to be enacted. It is possible to achieve a more equal distribution of wealth: Slovakia’s wealth Gini coefficient sat at 0.38 in 2024 according to the Global Wealth Databook referenced earlier, emblematic of a much fairer distribution of resources than that seen in this country. With the facts presented above in mind, is it time to rethink how we govern wealth?
